Designing a Modular Business Dashboard for Better Decisions
I designed a customizable dashboard for Mupra to help business owners understand their business faster, monitor important changes, and use AI to move from insights to action.
- Period
- Dec 2024
Context & Goal
Many business owners have access to a lot of data, but do not always have a clear view of what is happening in their business. They often need to open different pages to check sales, revenue, orders, inventory, delivery time, and customer satisfaction.
The goal was to create a dashboard that gives managers a useful daily summary in a few minutes. The dashboard should also be flexible enough to support different business needs instead of showing the same information to everyone.
Challenge
Businesses do not all need to track the same metrics. A restaurant manager may care about out-of-stock products and delivery time, while another business may focus more on revenue, expenses, customers, or sales forecasts.
The challenge was to show enough information to support good decisions without making the dashboard crowded or difficult to understand. The experience also needed to go beyond reporting and help managers take action based on what the data showed.
Research & Insights
We looked at the information business owners need to review during their daily work. The main problem was not the lack of data; it was the effort required to find, connect, and understand it.
Several insights shaped the design:
- Managers need a quick overview before they explore deeper details.
- Different businesses need different reports and levels of information.
- Important changes, such as low stock or falling revenue, should be easy to notice.
- Charts are more useful when they help users compare performance and understand trends.
- Insights become more valuable when they lead to a clear next action.
This shifted the dashboard from a fixed report page to a flexible workspace for monitoring and decision-making.
Hypotheses
We hypothesized that a modular dashboard could help business owners understand their business faster and make more informed decisions.
- Customizable report modules would make the dashboard more useful for different business types.
- A daily summary would reduce the need to visit several sections to understand business performance.
- Clear alerts for issues such as low stock or long delivery times would help managers respond earlier.
- Forecasts and comparisons would make trends easier to understand than raw numbers alone.
- AI-supported analysis could help managers turn business insights into practical actions.
Solution
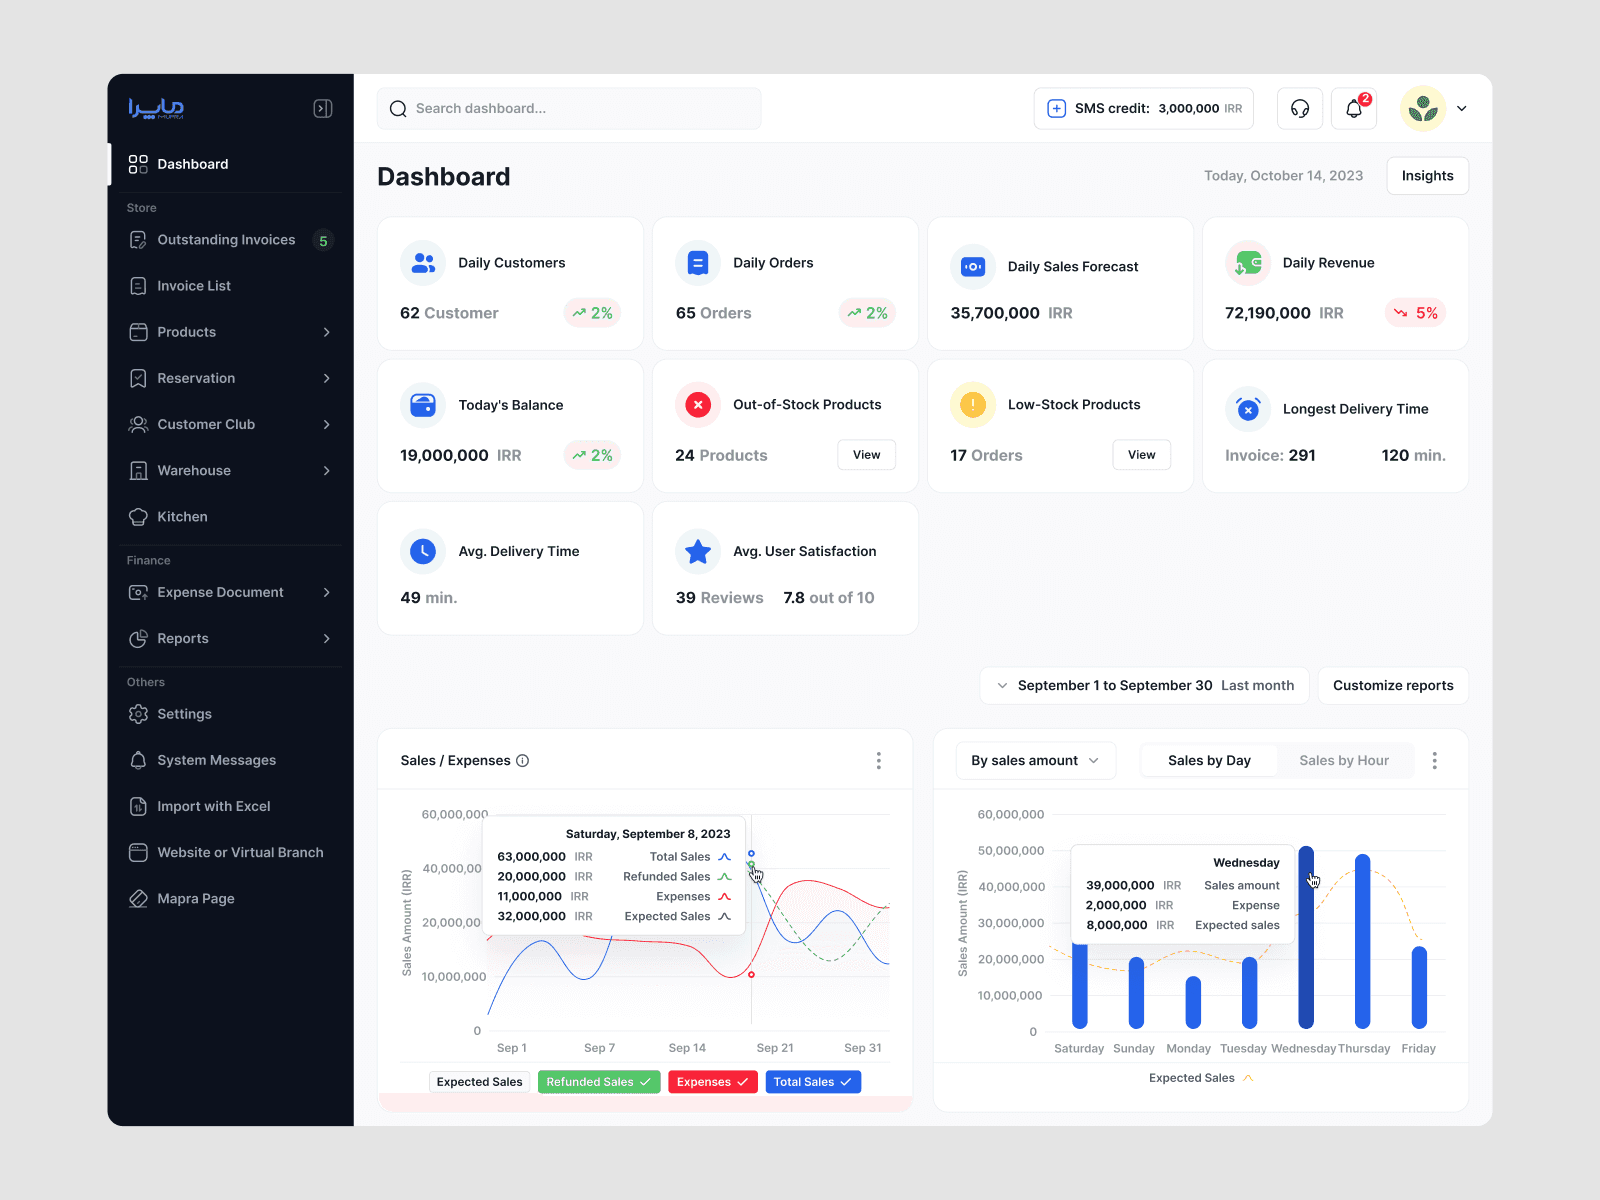
The dashboard was designed as a customizable workspace with modules for the most important business signals.
- Daily customers, orders, revenue, balance, and sales forecasts
- Out-of-stock and low-stock product alerts
- Longest and average delivery time
- Customer satisfaction and review information
- Sales, expenses, refunds, and expected sales charts
- Date ranges and filters for reviewing different periods
- Modular reports that managers can customize based on their needs
The dashboard also created a foundation for AI-supported insights. An AI agent could help managers understand changes, compare performance, and take actions such as creating a promotional campaign, identifying products that need attention, suggesting inventory actions, segmenting customers, or preparing a business report.
The aim was to keep managers in control while reducing the effort needed to move from data to a useful decision.
Impact & Results
The dashboard brought key business information into one place and made it possible for managers to review their business status in a few minutes each day.
The modular structure created a more flexible experience for different business needs, while alerts and visual comparisons made important changes easier to notice. The AI foundation also opened a path from passive reporting to active business support, such as creating campaigns, improving inventory decisions, and finding growth opportunities.
The main outcomes were faster daily monitoring, clearer access to business insights, better support for different reporting needs, and a scalable foundation for AI-assisted decision-making.
Summary
The dashboard was designed to do more than display business data. It helps managers understand what is happening, decide what needs attention, and take the next action with more confidence.